How to create SVG Paths with code
Published on: September 1, 2023
Back to the Blog indexAlmost all the vector graphics (SVG) we export in tools like Illustrator include at least one <path> element.
In fact, any shapes we draw with those tools are transformed into paths that describe, through the use of numbers and certain letters, the coordinates of each line or curve that compose the whole vector graphics.
You may have used lots of SVGs in your day-by-day work, for example, icons and illustrations where you have seen the <path> element in action, but like me, had just a basic understanding of how it works.
Recently, I’ve come across an inspiring resource that teaches the use of the d attribute of path elements.
I recommend that you explore that resource, but you can also continue reading this post which is a summary that may also interest you if you want to draw basic shapes with code, using the SVG <path> element.
The d attribute and its commands
Every path you work with in SVG markup has a d attribute. Its value is a series of commands, represented with letters, that dictate to the browser how the path has to be placed and drawn. The letters are followed by numbers that can be understood as the command parameters. They correspond to the orientation and placement of the different anchors, lines, and curves that compose the whole path. In the rest of this post, we will demystify the d commands and how they are used to draw lines, curves, and arcs.
Coordinates
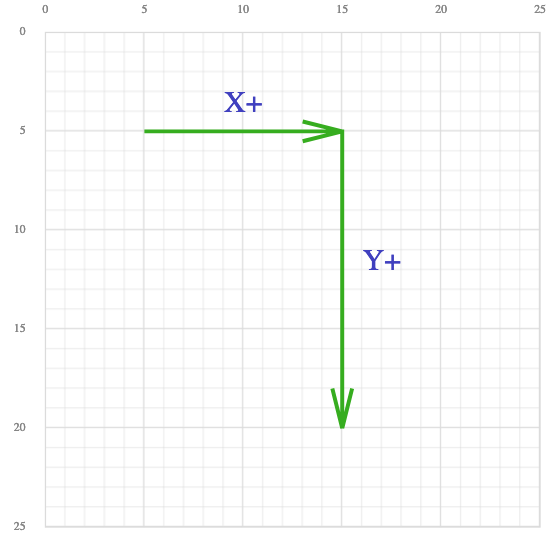
Any point in the SVG viewport is positioned using an (x,y) coordinate. The positive X coordinate is directed to the right and the positive Y coordinate is directed to the bottom of the viewport as the following image illustrates:

For the rest of this post, I will be using this naming convention for the different points that are used in the d commands’ parameters, which will most of the time be pairs of coordinates X,Y.
Absolute vs. Relative commands
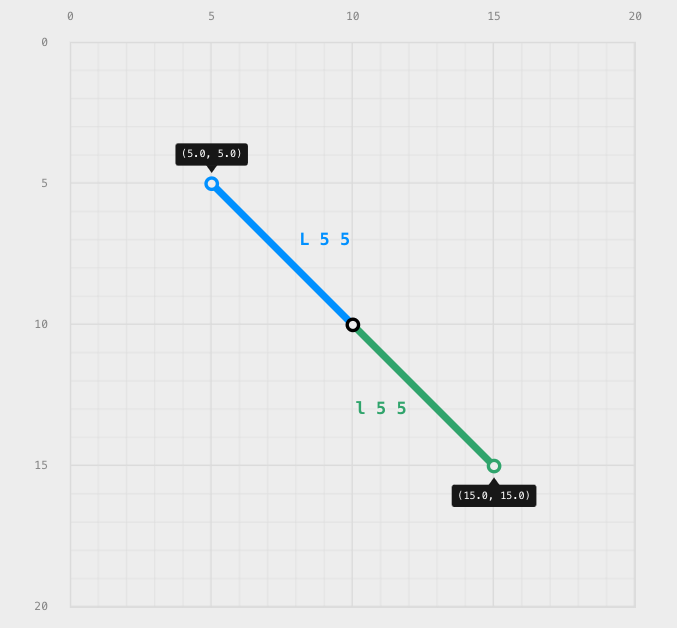
The letters you see in the d attribute, represent, as I mentioned before, commands. But you may have already realized that there are uppercase and lowercase letters. For example, we can find the letter L and its lowercase counterpart l. The uppercase commands are absolute and their parameters are relative to the origin point, whereas lowercase commands are relative to the previous command endpoint. The following is an example taken from https://www.nan.fyi/svg-paths. The picture shows that the first line (blue) is drawn with an absolute L command (L 5 5), relative to the origin (0,0) and the relative l command (l 5 5), has its origin in (10, 10) which is the endpoint of the previous command.

Cursors
To determine where to start drawing, the paths use the cursor and then move it towards the following command starting point. The origin point is (0,0), then, starting with the M command, the cursor moves to the position the next command specifies with its parameters.
Let’s review the following pen. There, we have set the d attribute like so:
M5 5 L10 10 L5 15 h5
This is the sequence of commands:
- M5 5 Move the cursor to the initial position (5,5)
- L10 10 Draw a line from the position (5,5) to the coordinate (10,10). The cursor is now in this position.
- L5 15 Draw a line from the position (10,10), moving the cursor to the new position (5,15)
- L10 15 Draw a horizontal line 5 units to the right. This moves the cursor to the final position (10,15)
Actually, you won’t see the cursor rendered (as a point or any visual symbol), but it’s important for us to know where this is placed at each path segment. Now, let’s review the different commands used to draw a path.
The M and m commands
The M command allows you to position the cursor to a new coordinate point. From that, you can start drawing or moving the cursor to new positions. This command doesn’t render any visual path line or mark, so it’s important to have a good sense of the cursor position inside the SVG document to know where it will be located. The following is a new pen with an SVG whose path is a prolongation of the previous example:
The first M command positions the cursor at the point (5,5), from where the rest of the path is drawn until the end of the horizontal line (h5). Then, a new jump is created towards the point (3,-2), using the m command. Here, I’m using the lowercase m command to position the cursor relative to the end of the horizontal line (h5), and then a new line is drawn (l2 -2). Note that I’m using a negative y coordinate value -2, not a dash 2 value. This clarification is in case we get confused when we see this command in other SVG markup.
The L and l commands
This command letter is used to draw lines with a direction given by a coordinate. In the previous Codepen, we have drawn 2 lines with an L command, which are described in the Cursor section, and an extra line with the relative l command as reviewed in the previous section.
The Z command
When you want to “close a path”, you use the Z command. In this Codepen, If we want to draw a closing line from the end of the path at position (10,15) to the start of the path at (5,5), we could write a line command l-5 -10, but using the Z command we don’t need to specify a new command and the path is closed. So the final path results in the following:
<path d="M5 5 L10 10 L5 15 h5 Z" />
Vertical (V command) and Horizontal (H command) lines
To draw straight lines, vertical or horizontal, we can use the V and H commands and their respective relative lowercase versions. Again, we could also draw these kinds of lines with just the L and l commands, but H and V are shortcuts to do it more simply.
Following, we have a new version of a previous example. The path is prolonged by drawing straight vertical and horizontal lines (relative lines) sequentially after the L commands. The final path is:
<path d="M5 5 L10 10 L5 15 h5 v3 h2 v-13 h-7"/>
Bézier curves
Bézier curves are a fundamental concept in computer graphics, mathematics, and vector-based drawing. They are used to create smooth curves by defining a series of control points that influence the shape of the curve.
SVG supports two types of Bézier curves, quadratic and cubic. Quadratic curves have one control point, and cubic curves have two control points.
Quadratic bézier curves
When you don’t need to draw complex curves, you can use Quadratic curves, which use just a point of control. The following is the command you use to plot a quadratic curve:
Q controlX controlY endX endY
The following is an example of a Quadratic curve:
In this example, the quadratic curve is given by the command
Q15 10 7 15 .The first pair of numbers after the Q command, correspond to the control point (10,7), which enables us to “handle” the curve to a desired position. The dashed lines, show where the quadratic control point is placed relative to the start (8,8) and end of the curve (7,15).
Experiment with changing the control point and the endpoint (7,15) in the quadratic curve example to see the different shapes it becomes at different positions.
Chaining Quadratic Curves
To draw consecutive quadratic curves, you can use the T command. With this command, you define just the end point where you want to finish the new chained curve, like the following pen:
Look at the path <path d="M 5 5 h3 Q15 10 7 15 T8 23"/>
Following the quadratic curve Q15 10 7 15 we previously described, we have added a T command that specifies an ending point (8,23) to form the chained curve, which is drawn using the reflection of the original curve’s control point. If we change this control point, the chained curve will also change accordingly.
Cubic bézier curves
As cubic bézier curves have an extra control point, we can generate smoother shapes. The command syntax to create a bézier curve is the following:
C controlX1 controlY1 controlX2 controlY2 endX endY
Let’s review this Codepen:
The path that draws the bézier curve is:
<path d="M7 10 C3 2 15 0 18 8" />
From the initial position (7,10), we create the first control point at (3,2) and the second at (15,0). The endpoint of this curve has been placed at (18,8). You may want to experiment with moving the control points and see how the shape changes, just don’t forget that in this example, there are other paths that are there to help us illustrate the bézier curve control points, and if changing the C command won’t affect those signifiers, at least you also have to alter its paths commands.
Chaining Cubic Curves
The same as quadratic curves, we can chain cubic curves using the S command. This will prolong the cubic curve using a new control point and the point where we want the curve to end. The syntax is as follows:
S ControlX ControlY EndX EndY
You can see an example of chaining in the following pen:
The path M7 10 C3 2 15 0 18 8 that we draw in the previous example, is prolonged using the new S command: S0 15 7 10. The new control point for the prolonged path is (0,15) and the endpoint is (7,10). Notice we have continued the path from point (18,8), which is the endpoint of the first path.
Arcs
To draw a section of an ellipse we can use the Arc (A) command. The syntax is more complex than the previous curves, but we’re going to decipher in this section.
A rx ry rotation large-arc-flag sweep-flag x y
An example can be observed in the following pen:
and the Arc drawn is this path:
<path d="M5 7 A10 7 0 0 0 20 17" />
This arc curve corresponds to an ellipse of rX=“10” and rY=“7”. For the moment, we have just specified an ending point at (20,17).
The implicit ellipse that complies with the arc radius adapts according to the radius and the endpoint. If we change any of these points, we’ll see that sometimes the arc becomes smaller or larger and the position of the implicit ellipse also adapts accordingly.
Let’s review the rest of the A command parameters.
The first parameter after the radii, which is highlighted here:
d=“M5 7 A10 7 0 0 0 20 17”
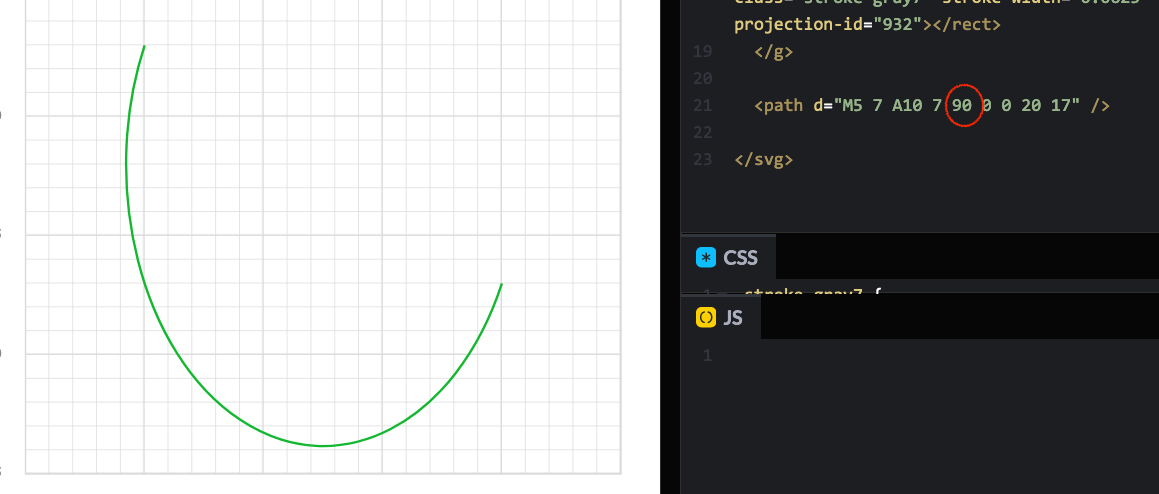
It’s called the x-axis-rotation. This value rotates the ellipse around the horizontal axis. Change the rotation parameter in our previous example and see the arc has a different position. For example, if we rotate it 90deg, we can have the following:

The next two parameters are called the large arc flag and the sweep flag respectively. They can have only values 0 or 1. These flags correspond to the ellipse that the browser tries to draw using the radii and endpoints. Actually, there could be 4 possible arcs that can be plotted on that ellipse. The large arc and sweep flags control which of the 4 arcs is drawn.
Let’s change the large arc in our example. At first, with the same endpoints, we won’t see any difference, but change the end points towards the ellipse that is drawing up, for example to the point (15,5) or even closer to the starting point (7,6), and you’ll see how the arc is larger and seems to be closing the ellipse. So setting the large arc to 1 makes the arc larger than the one set with flag 0

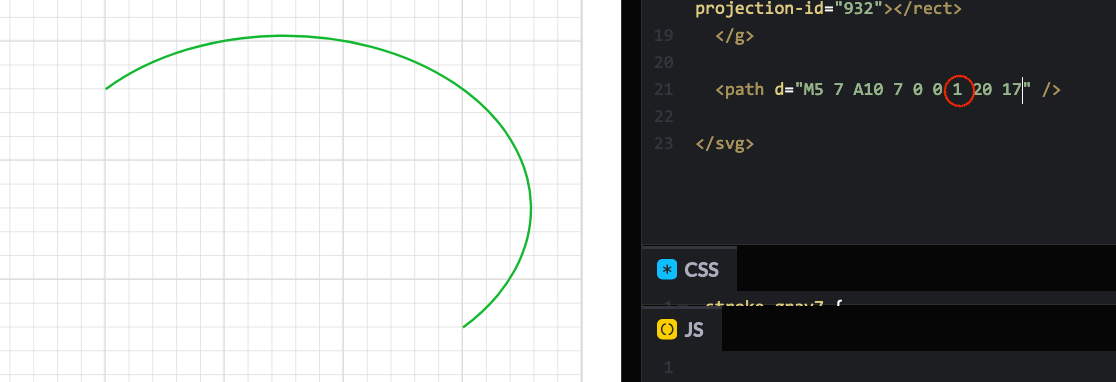
The same with the sweep flag, we can generate two arcs. Let’s update our example, setting this flag to 1, and see what happens:

This arc uses the original endpoints (20,17), but as we change the sweep flag to 1 the new one is drawn on the opposite side of the ellipse.
Conclusion
This has been a quick summary of the <path /> SVG element and its d attribute. We have reviewed the different commands to produce lines and bézier curves. To understand the complexity of these commands we have to practice a lot, and I absolutely recommend you follow this Website, upon which this post is based; where you will find interactive examples and exercises to practice all you learn about paths, step by step. It even includes a page full of challenges so you become proficient!
You can also check out the MDN documentation on paths. Here you’ll find another interesting tutorial on the subject.
What is next? Don’t forget that paths can be animated. Check out my post on path animations so you can start right away with the awesome library GSAP.